|
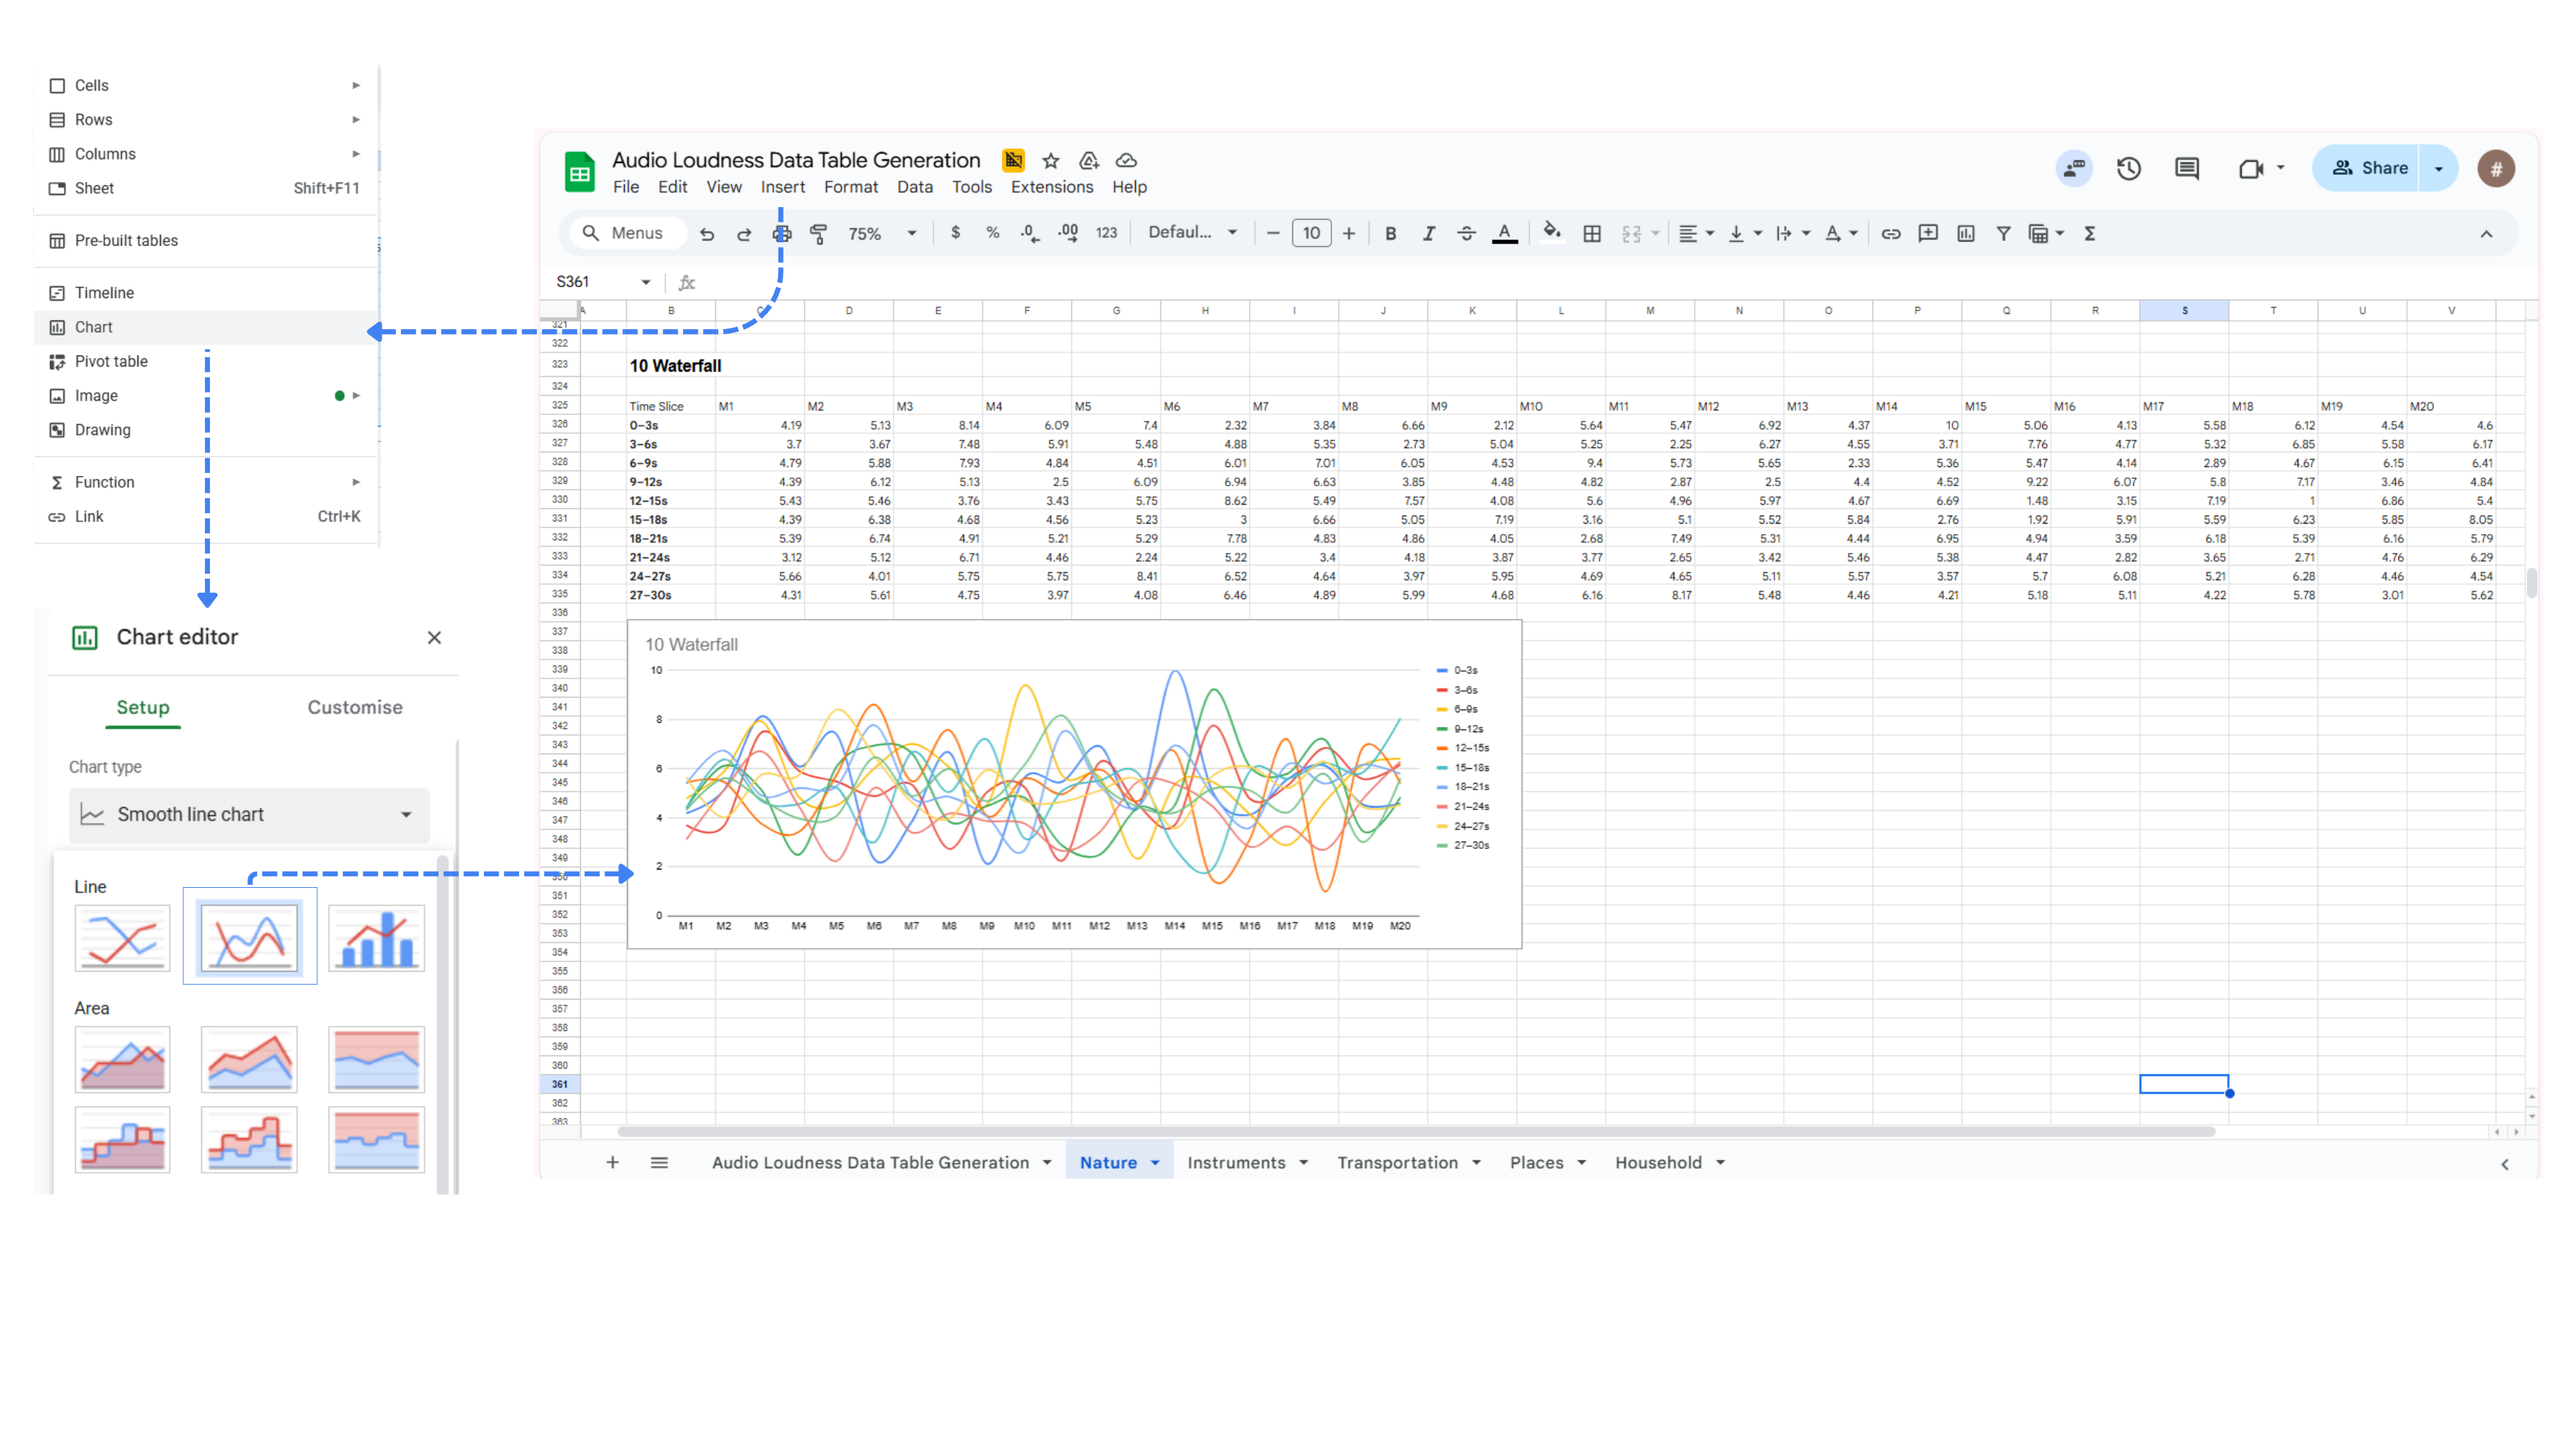
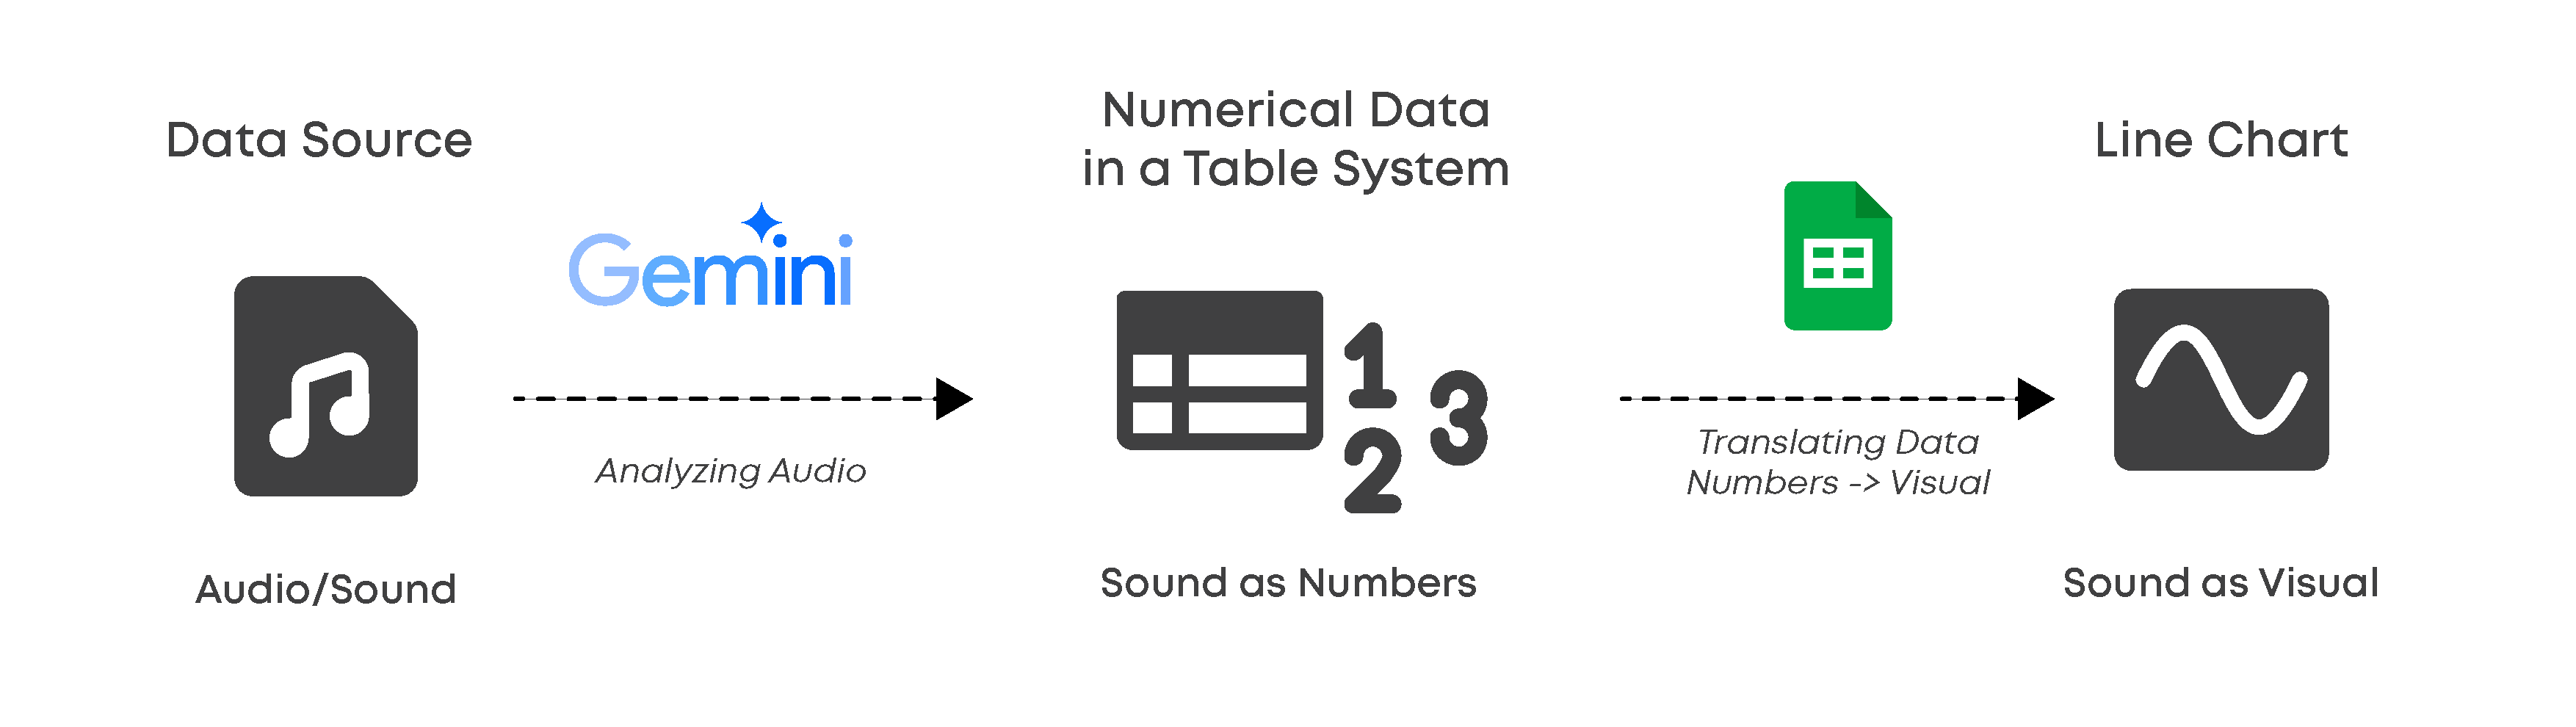
This project explores the intersection of sound analysis and non-traditional data visualization by rethinking how sound can be translated into data. While software such as Microsoft Excel and Google Sheets is commonly used for financial or statistical calculations, this project repurposes these tools as platforms for micro sound analysis. By treating audio files as raw data sources, I use spreadsheet charting features to visualize the internal “personality” and behavior of sound in ways that differ from conventional audio software.
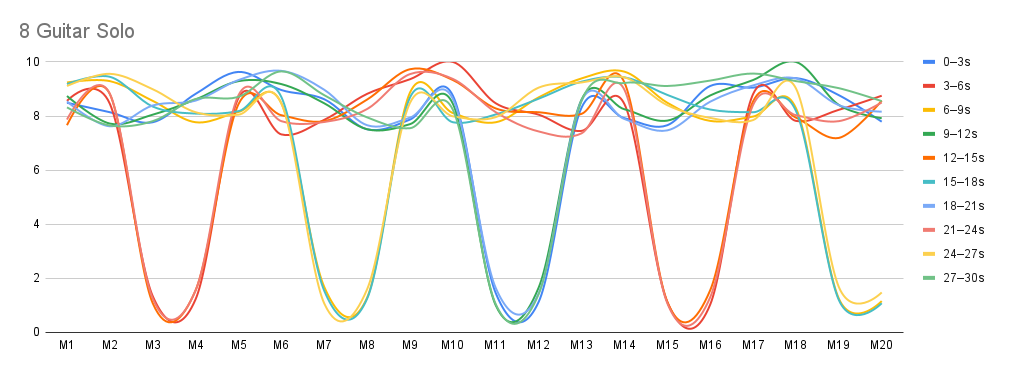
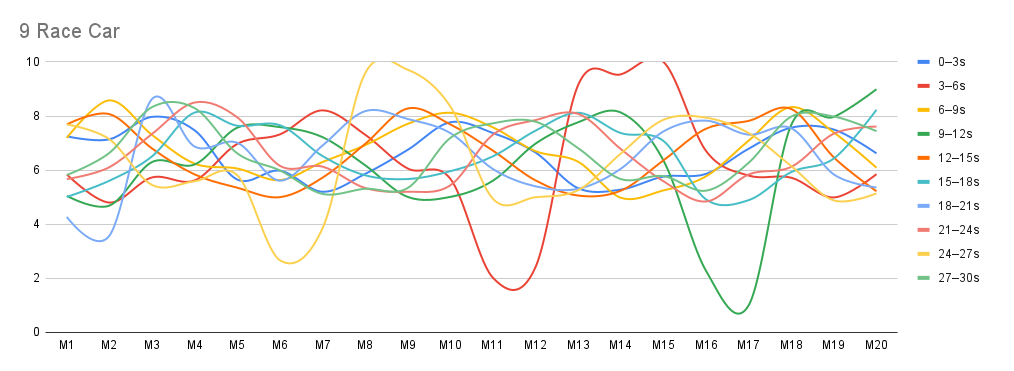
Rather than relying on standard waveform graphs that measure sound objectively through decibels (dB), this project focuses on relative dynamics. Each sound is analyzed only in relation to itself, rather than by absolute loudness. At the same time, it becomes clear that sounds at very different perceived intensity levels—such as very soft and very loud sounds—can display similar dynamic patterns or consistent behavior over time.
This demonstrates that a sound’s internal fluctuations and “personality” are not determined by its volume alone, allowing patterns and behaviors to be observed independently of intensity.
Through an iterative process of trial and error, the project reveals that conventional dB-based visualizations often flatten subtle yet expressive aspects of sound. Even sounds perceived as quiet or steady can contain rich, complex internal dynamics when analyzed through this framework. By rethinking what counts as data and how it is structured, data-processing software becomes a creative tool for uncovering hidden patterns and offering new perspectives on everyday sound.
|
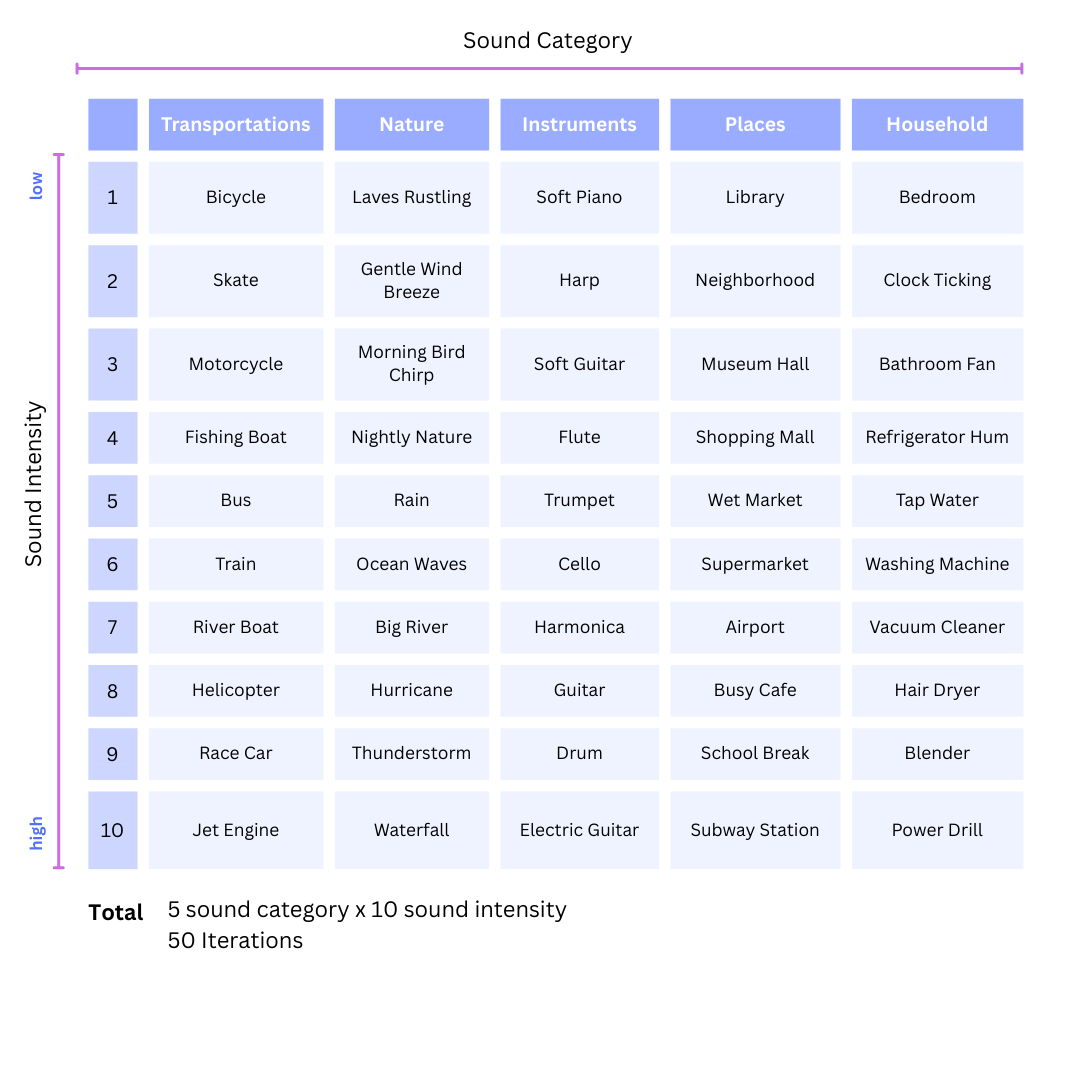
- Audio files sourced from open-source libraries, primarily Pixabay
- Only the first 30 seconds of each audio file are used for analysis
- Sounds are selected to span calm ambient textures to intense, aggressive sources
- Loudness is ranked subjectively on a 1–10 scale based on perceived intensity and contextual logic
- Each audio file is analyzed only in relation to itself, not compared across sounds
- All sounds follow the same analysis and visualization pipeline
- Primary parameters: time and perceived audio loudness
|
Task:
Analyze an uploaded audio file and convert it into a numerical data table based on loudness over time. Do not interpret the sound. Only measure and translate it using the rules below.
Rules:
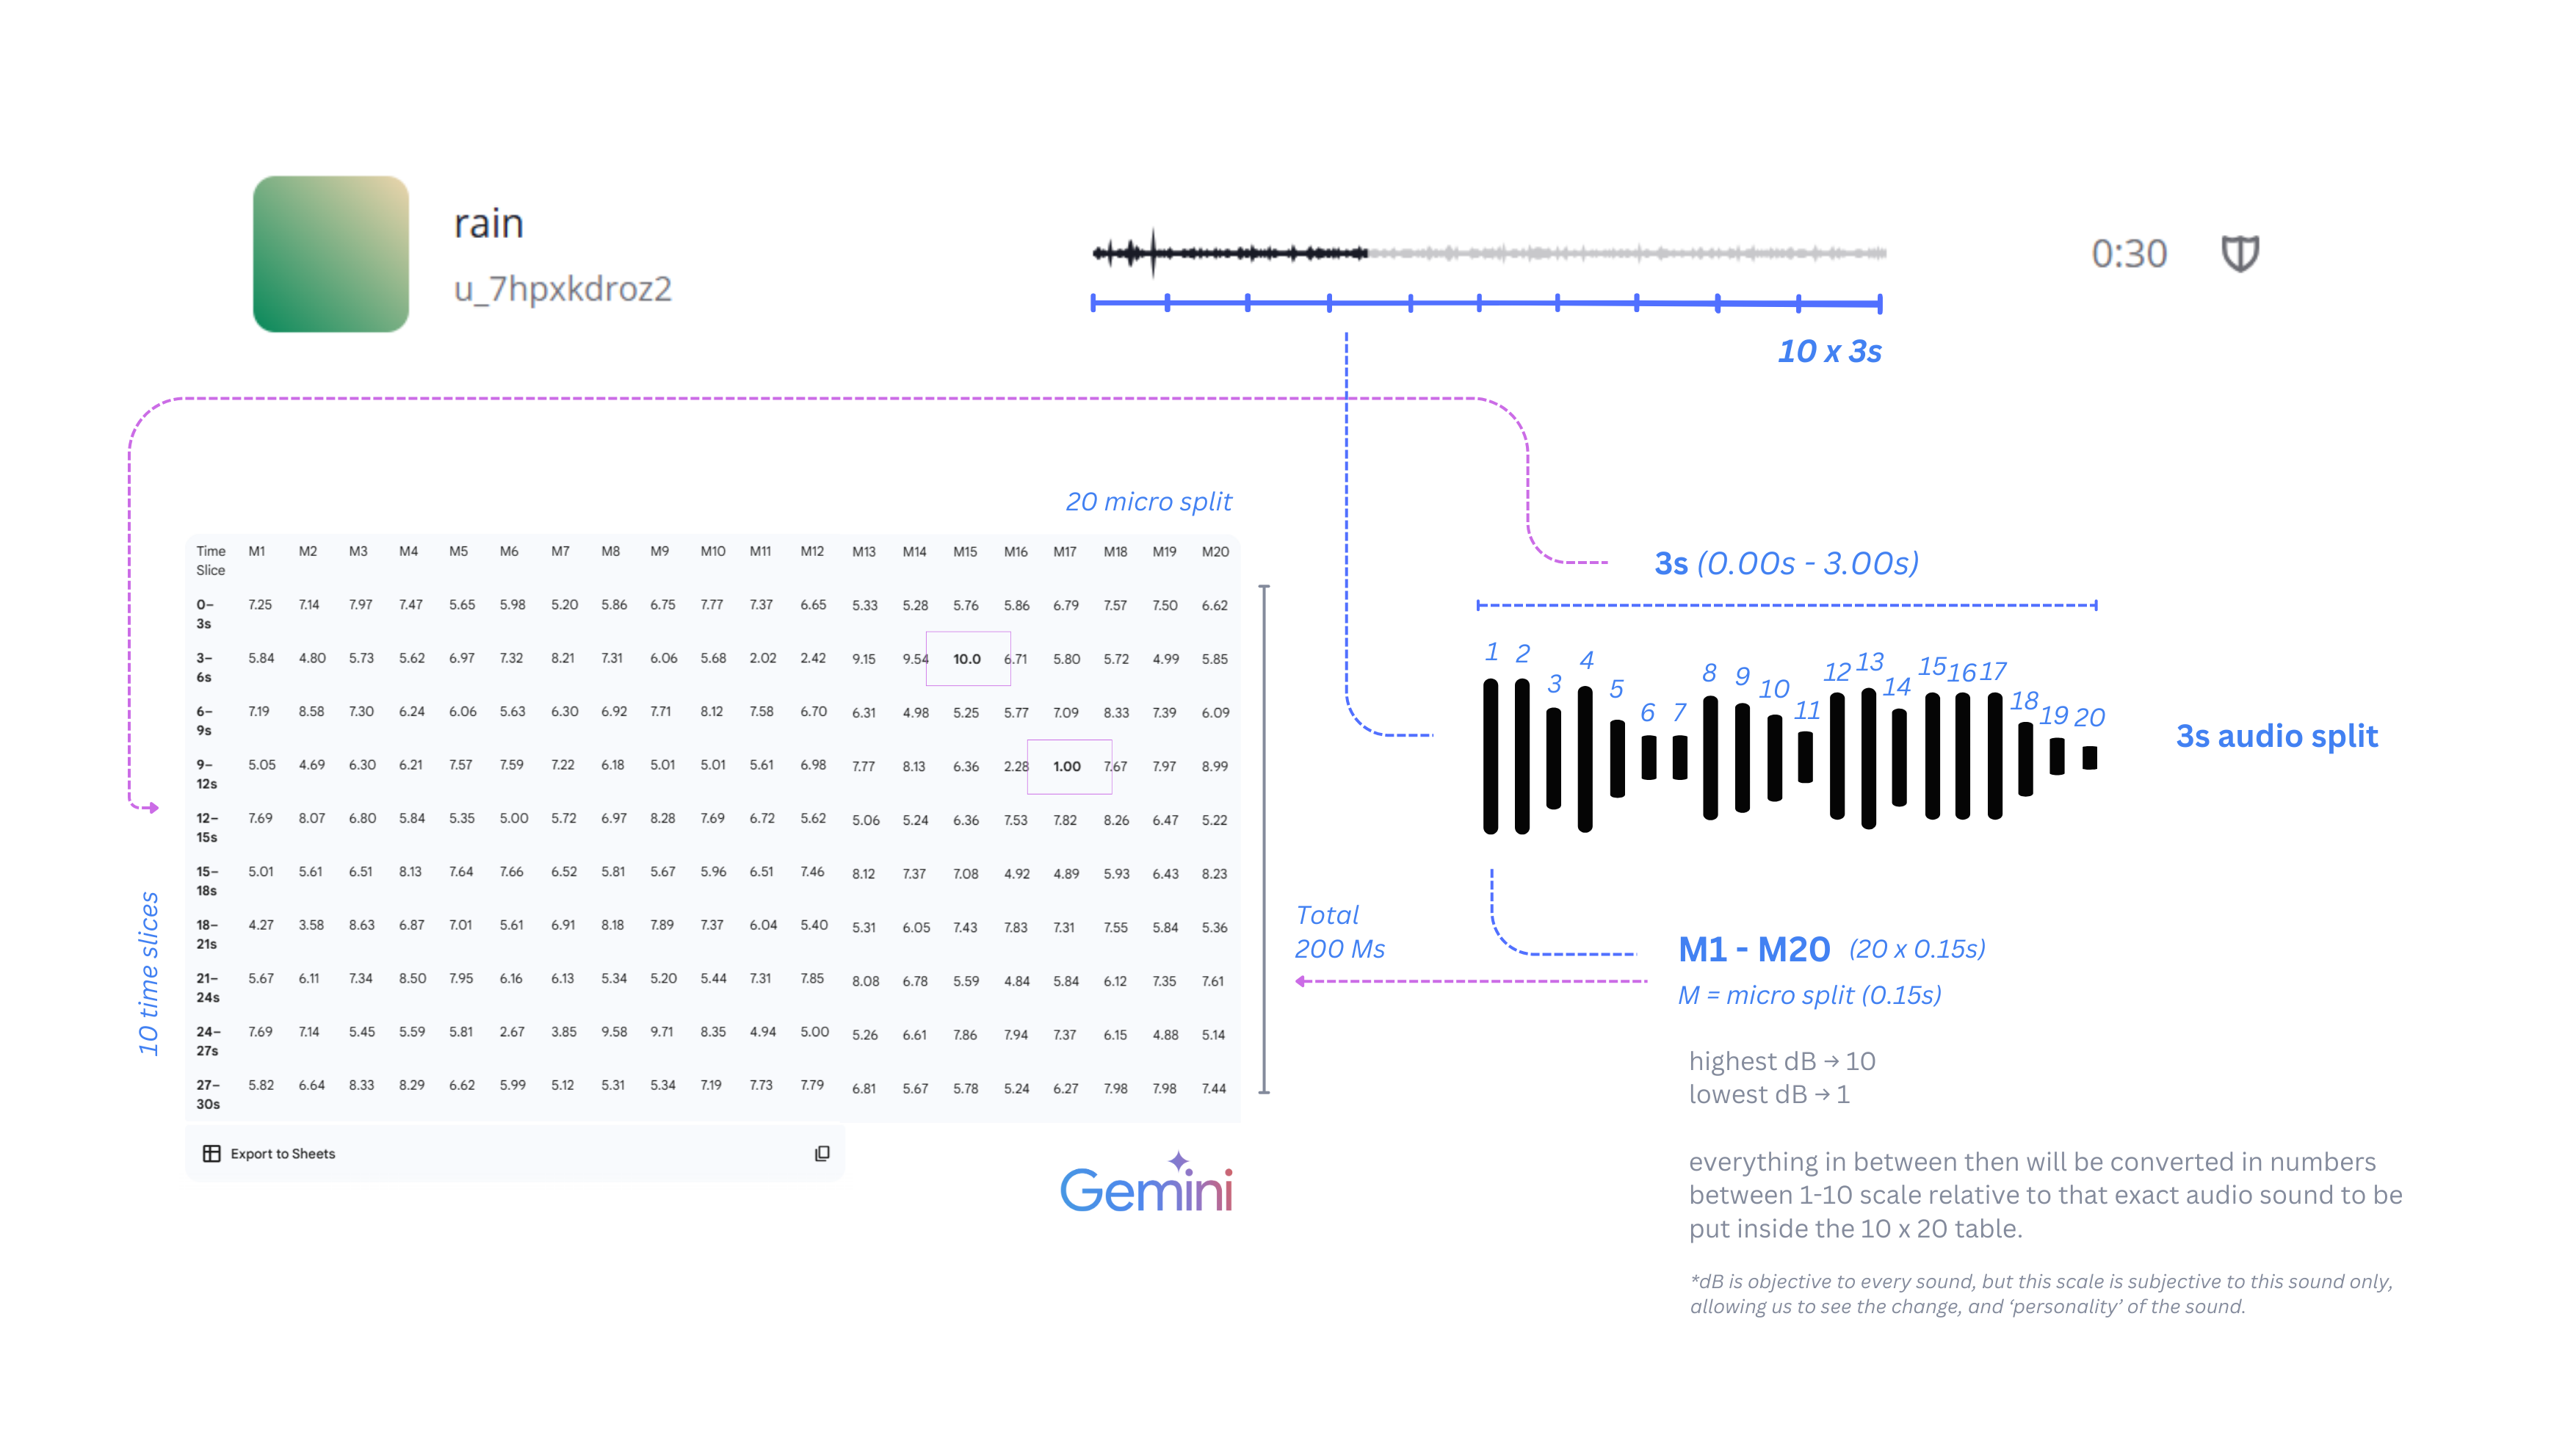
- Use only the first 30 seconds of the audio file.
- Divide the 30 seconds into 10 equal time slices:
- Each slice = 3 seconds
- Subdivide each 3-second slice into 20 equal micro-windows:
- Each micro-window = 0.15 seconds
- For each 0.15-second micro-window:
- Measure RMS (root mean square) amplitude as loudness
- If audio is stereo, convert to mono before measuring
- Collect all RMS values from the 30-second duration and:
- Normalize them relative to the minimum and maximum values
- Map them onto a 1–10 scale
- 1 = quietest measured segments
- 10 = loudest measured segments
- Keep decimal values (do not round to integers)
- Output the result as a table:
- Rows = 10 time slices (0–3s, 3–6s, …, 28–30s)
- Columns = 20 micro-windows (M1–M20)
- Cells = normalized loudness values (1–10)
- Constraints:
- Do not invent values
- Do not interpret meaning or emotion
- Do not adjust data for aesthetics
- Do not change time slicing after analysis starts
Goal: Translate time-based sound variation into structured numerical data using fixed, repeatable rules.